FIFA World Cup Draft Pool
Fantasy draft order for 48 users across 5 pools — calibrated by Monte Carlo simulation, validated against real tournament data. Ran the full 2026 World Cup: 103 matches, 270 fantasy points awarded, scoring model confirmed.
The Problem
12 friends enter a pool. Each person is randomly assigned 4 World Cup teams — one from each tier. As the tournament plays out, your teams earn fantasy points. Most points = first pick in the NFL fantasy football draft. But without accounting for team strength, the person who gets Spain and France always wins. The scoring needed to be fair — every tier should matter.
What I Built
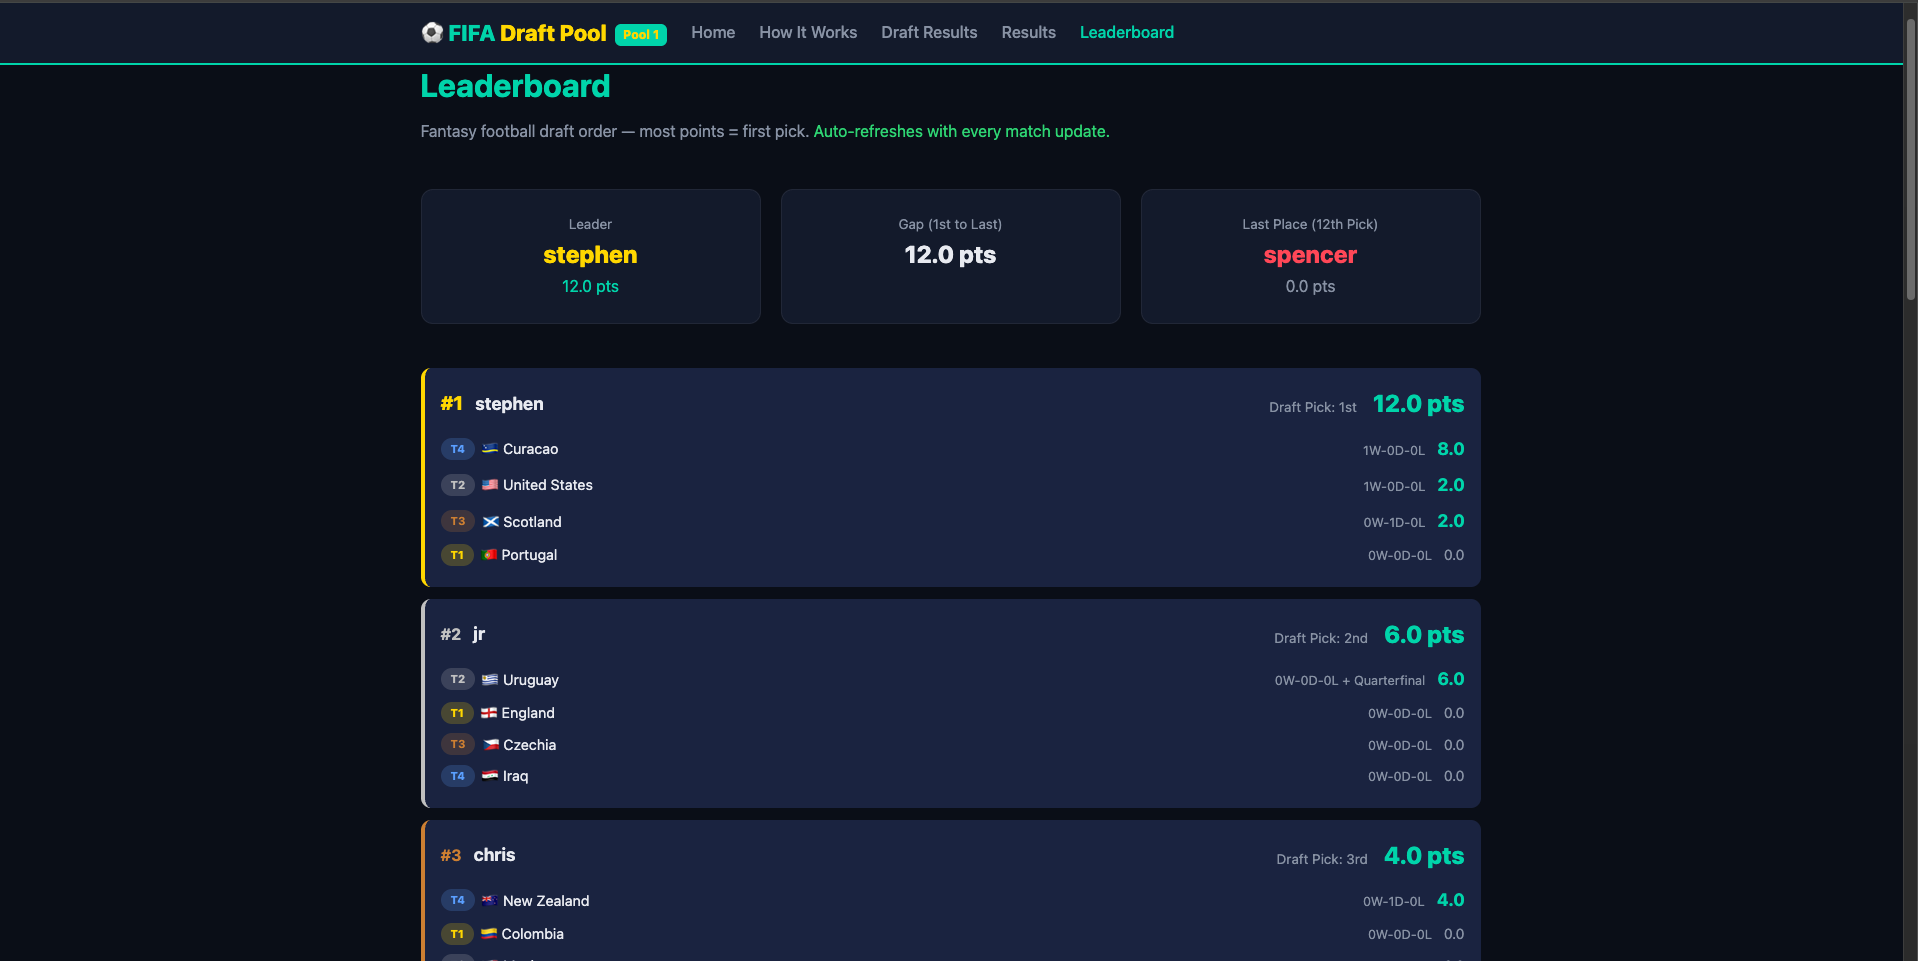
A full-stack web app that manages the entire pool lifecycle: draft randomization with group-conflict constraints, live match result entry, fantasy point calculation with tier-weighted multipliers, and a real-time leaderboard. Five independent pools (three 12-person, one 10-person, one head-to-head) share the same codebase with separate KV namespaces, and a central admin hub fans out match results to all five simultaneously.
The scoring system was calibrated using Monte Carlo simulation — 5,000 full tournament runs using real betting odds. The simulation revealed that without tier multipliers, Tier 1 teams dominated ~96% of every owner's score. The chosen multipliers (1x/2x/4x/8x) were designed to produce balanced contribution across tiers — each tier accounting for roughly 25-30% of the winning owner's score.
Post-Tournament Results
The app ran the full 2026 World Cup — 103 matches from group stage through the Final (Spain 1-0 Argentina). After the tournament, I wrote a Python analysis script that pulled live data from all 5 pool APIs and validated the scoring model against real outcomes.
Tier Balance: Validated
The Monte Carlo simulation predicted each tier should contribute ~25-30% of total fantasy points. The real tournament delivered:
| Tier | Multiplier | Actual % | Without Multipliers |
|---|---|---|---|
| T1 — Favorites | 1x | 30.7% | 60.6% |
| T2 — Contenders | 2x | 21.1% | 20.8% |
| T3 — Dark Horses | 4x | 27.4% | 13.5% |
| T4 — Cinderellas | 8x | 20.7% | 5.1% |
Spread of 10 percentage points across all 4 tiers. Without multipliers, T1 would have dominated at 61% and T4 would have been irrelevant at 5%. The multiplier system compressed this to a 21-31% range — the sim's design goal held against real-world variance.
Headline Stories from the Data
- • Cape Verde (1000-1 odds, T4) never won a single match — 0W-3D-0L — but earned 12.0 fantasy pts from draws alone, tying Argentina and outscoring Brazil, Germany, Portugal, and Netherlands
- • Egypt (300-1 odds, T3) was the #2 most valuable team in the tournament at 14.0 pts, behind only champion Spain (18.0). Whoever drafted Egypt won their pool in 3 of 4 standard pools
- • A single T4 group stage win (8.0 pts) was worth more than Spain winning the entire Final (5.0 pts) — the multiplier system working exactly as designed
- • Cross-pool comparison showed draft luck dominated outcomes: the same 103 matches produced pool winners ranging from 29.5 to 41.0 pts and last-place finishers from 9.5 to 14.0 pts, purely based on random team assignment
Architecture
┌──────────────────────────────────────────────────────────┐
│                    Cloudflare Edge                        │
│                                                          │
│  ┌─────────────────┐     ┌─────────────────────────────┐ │
│  │  Workers (V8)   │────▶│     KV Namespace             │ │
│  │                 │     │  ┌─────────────────────────┐ │ │
│  │  - Router       │     │  │ owners: [...owners]     │ │ │
│  │  - Draft logic  │     │  │ results: [...matches]   │ │ │
│  │  - Scoring calc │     │  │ owner_names: [...names] │ │ │
│  │  - SSR HTML     │     │  └─────────────────────────┘ │ │
│  └─────────────────┘     └─────────────────────────────┘ │
│                                                          │
│  5 Pools (separate Workers + KV namespaces each)         │
│  3× 12-person pools, 1× 10-person, 1× head-to-head     │
│                                                          │
│  ┌─────────────────────────────────────────────────────┐ │
│  │  Admin Hub (admin.macksportreport.com)              │ │
│  │  Enter scores once → fans out to all 5 pool APIs   │ │
│  └─────────────────────────────────────────────────────┘ │
│                                                          │
│  ┌─────────────────────────────────────────────────────┐ │
│  │  Post-Tournament Analysis (Python)                 │ │
│  │  Fetches all 5 APIs → validates scoring model      │ │
│  └─────────────────────────────────────────────────────┘ │
└──────────────────────────────────────────────────────────┘
Technical Deep Dive
Scoring System
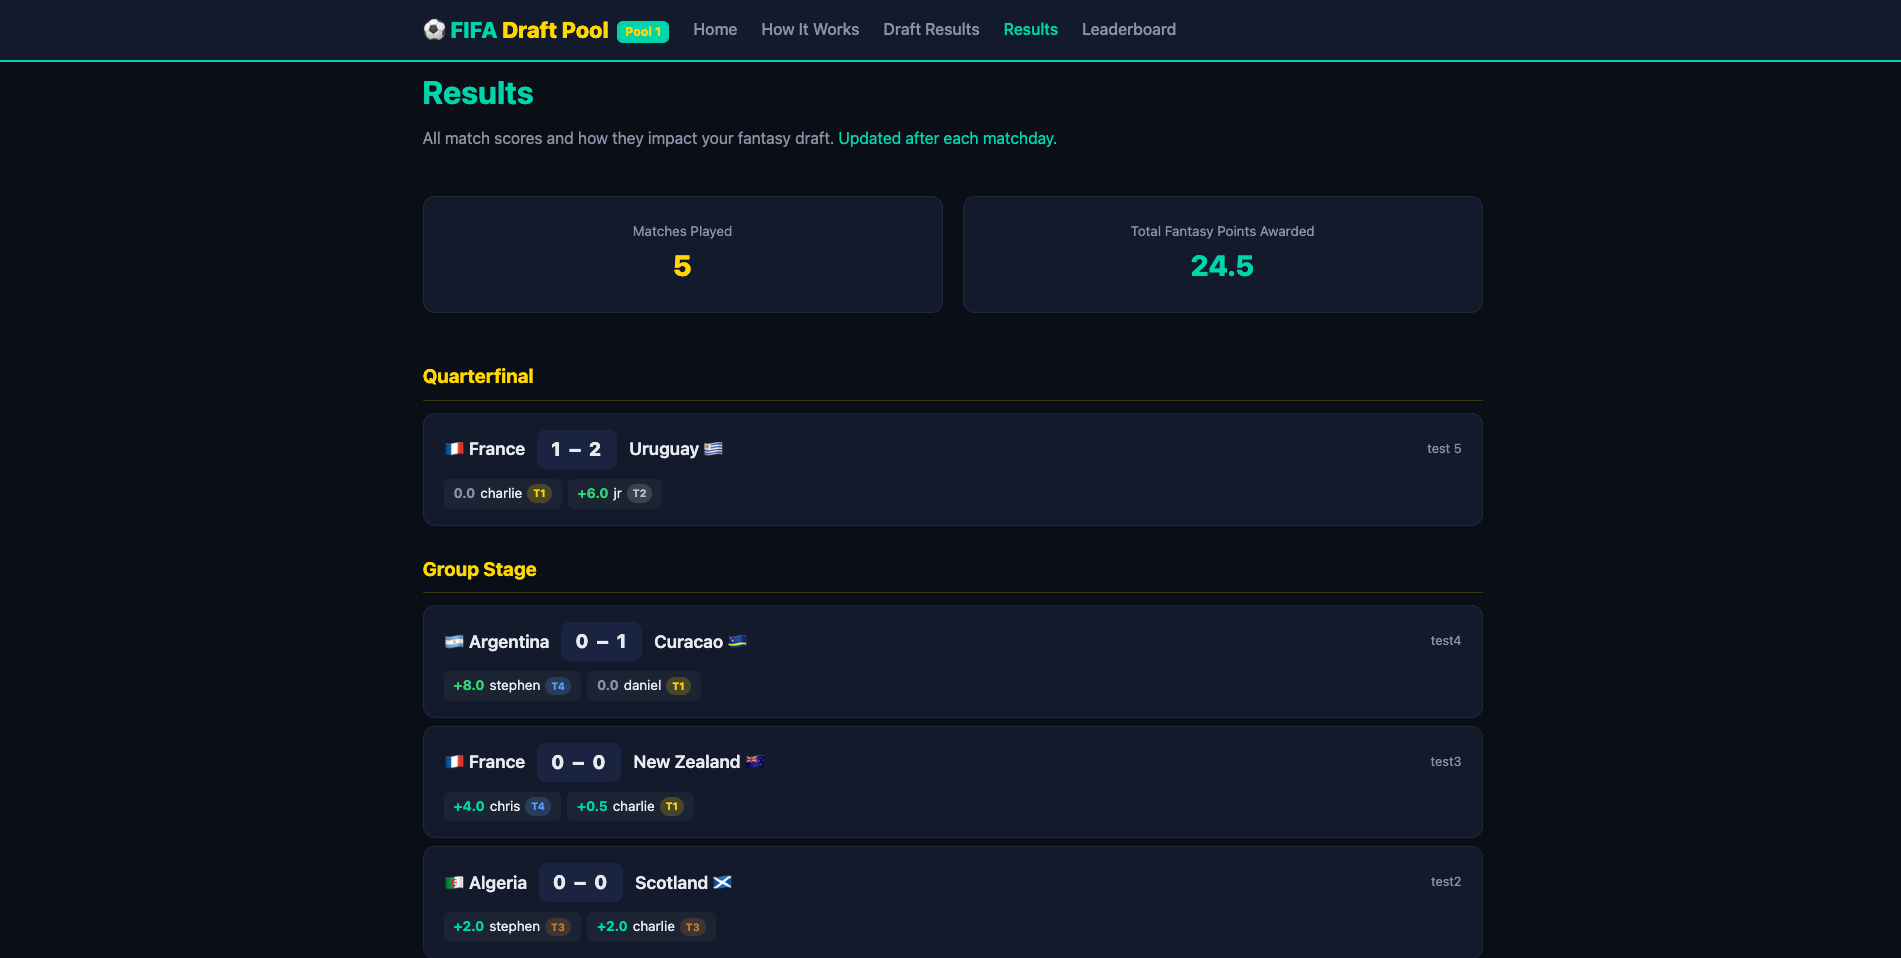
Points = Round Weight × Tier Multiplier. Group wins earn 1 point (base), while the Final earns 5 points. Tier multipliers scale these: T1 teams get 1x, T2 gets 2x, T3 gets 4x, and T4 (Cinderellas) get 8x. A T4 team winning a group match earns 8 points — the same as a T1 team reaching the semifinals.
Draft Algorithm
The draft randomizer assigns 1 team per tier to each owner with a group conflict constraint: no owner can have two teams from the same FIFA group (they'd play each other, creating a conflict of interest). The algorithm shuffles teams per tier and assigns greedily with backtracking, retrying up to 200 times if a shuffle produces an unsolvable assignment.
Multi-Pool Support
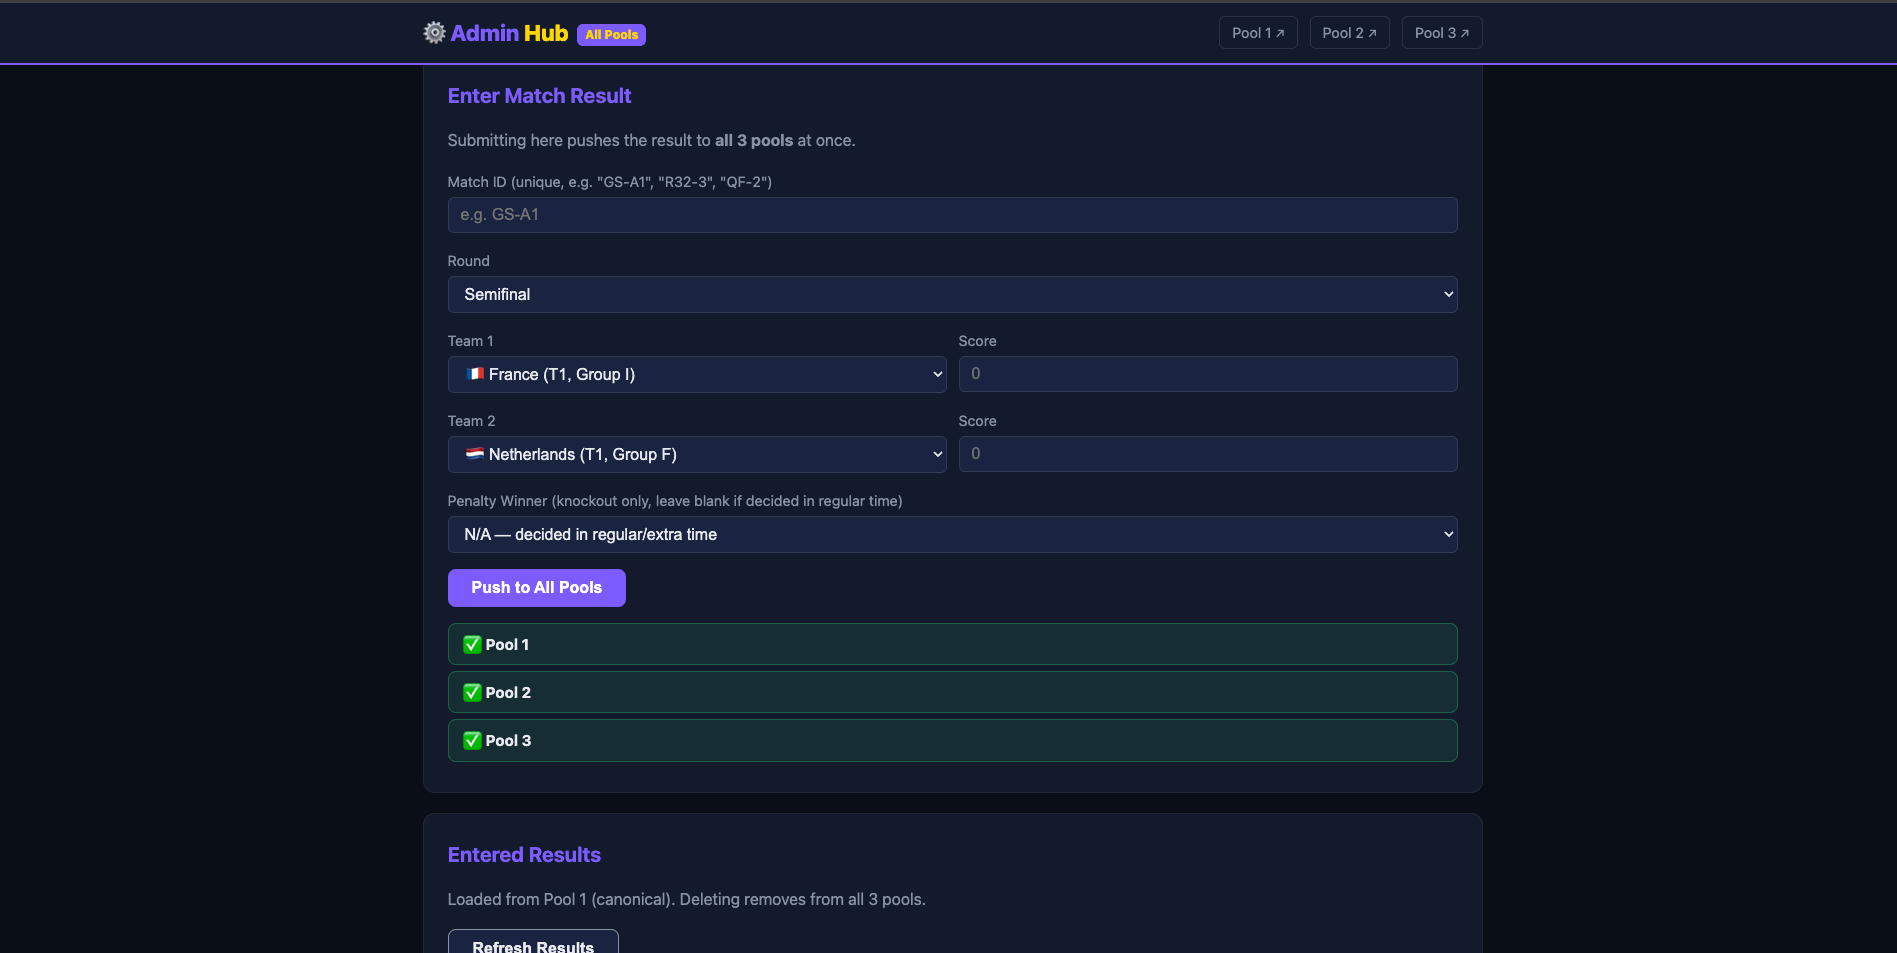
Five pools run on shared source code deployed as separate Workers with separate KV namespaces. Pools varied in size: three 12-person pools, one 10-person pool (with 40 teams instead of 48), and one head-to-head pool (2 owners, 24 teams each, different draft algorithm). A sixth Worker (the Admin Hub) acts as a fan-out proxy — when a match result is submitted, it fires 5 parallel fetch() calls to all pool APIs simultaneously.
Monte Carlo Calibration
The simulation/ directory contains Python scripts that ran 5,000 full tournament simulations using real betting odds. The simulation tested various multiplier combinations and measured tier contribution variance. The 1x/2x/4x/8x scheme was chosen because it produces the most balanced expected contribution: each tier accounts for ~25-30% of the winning owner's total score.
Post-Tournament Analysis
After all 103 matches were played, a Python analysis script fetched live JSON from all 5 pool APIs (identical match results, different owner-team assignments) and computed: tier-balance validation against the sim's predictions, team value rankings vs. pre-tournament odds, per-pool final standings with tiebreaker identification, and a cross-pool draft luck comparison showing how random team assignment variance drove outcome differences.
Cloudflare Products Used
Workers — Application runtime. 6 Workers total (5 pool instances + 1 admin hub). Full-stack SSR with routing, API handlers, draft logic, scoring calculations, and HTML rendering. Zero cold starts, global distribution. ~2,000 lines of TypeScript per worker, no framework.
KV — Global key-value storage. Three keys per pool (owners, results, owner_names) served the entire tournament lifecycle across 103 matches for 48 users. Sub-10ms reads at the edge.
Custom Domains — 6 custom subdomains via Cloudflare DNS + Workers routes. The same codebase deploys to multiple domains with different KV bindings — the white-label SaaS pattern.
Wrangler CLI — Single-command deployment. wrangler deploy pushes to 300+ edge locations instantly.
What I Learned
- • KV is the right database for simple global state — three keys per pool served an entire multi-round tournament for 48 users at sub-10ms reads with zero issues across 103 matches
- • Workers SSR replaces an entire Node.js server. No framework, no bundler, no cold starts, no Docker — total upload is 58KB (14KB gzipped)
- • Multi-tenancy via separate KV namespaces + identical Workers code is the pattern for white-label SaaS on Cloudflare — but copy-pasting source across 5 directories created ~7,850 lines of duplication that would have been a maintenance problem for a longer-lived project
- • Monte Carlo simulation predicted 25-30% contribution per tier — real tournament data landed at 21-31%, validating the model within a 10-point spread. The sim's counterfactual (T1 dominates at 96% without multipliers) showed up as 61% in practice — less extreme than predicted but still lopsided enough to prove the multipliers were necessary
- • Scoring granularity matters: 0.5-point increments across 4 teams per owner created ties in 3 of 4 standard pools. A tiebreaker cascade (knockout wins, then best single team) should have been designed into the scoring system from the start, not discovered after the tournament ended
Retrospective: What I'd Change
- • Consolidate the workers. Five near-identical
worker/directories with ~7,850 lines of duplication. Should be a single shared source parameterized bywrangler.tomlenv vars (NUM_OWNERS,POOL_NAME,DRAFT_MODE) and deployed withwrangler deploy --config pools/pool1.toml - • Move admin tokens to Cloudflare Secrets. Used
[vars] ADMIN_TOKEN = "admin"in plaintext, committed to git. Should usewrangler secret put— secrets are encrypted at rest and never appear in deployment configs - • Add input validation on the API. The
/api/add-resultendpoint accepted any JSON without verifying team names, score ranges, or round validity. A typo in a team name would silently produce zero fantasy points with no error - • Design tiebreakers upfront. Pool 1 had 3 ties affecting 6 of 12 draft positions. The leaderboard sorted by points only — no cascade for knockout wins, best single team, or coin flip. This should have been part of the scoring spec, not a post-tournament discovery
- • Add CORS to write endpoints. No origin restrictions on POST routes — combined with the weak admin token, any website could have submitted results. Defense-in-depth was missing
Career Relevance
- • Demonstrates Workers as a complete full-stack platform — compute + storage + routing, zero origin server
- • Multi-tenant deployment pattern maps directly to how startups build SaaS products on Cloudflare
- • Monte Carlo calibration shows data-driven product decisions, not just shipping features — and post-tournament validation proves the model held against real-world variance
- • The retrospective demonstrates engineering maturity: shipped it, operated it through a live event, analyzed the data, and identified concrete improvements — not just "I built a thing"